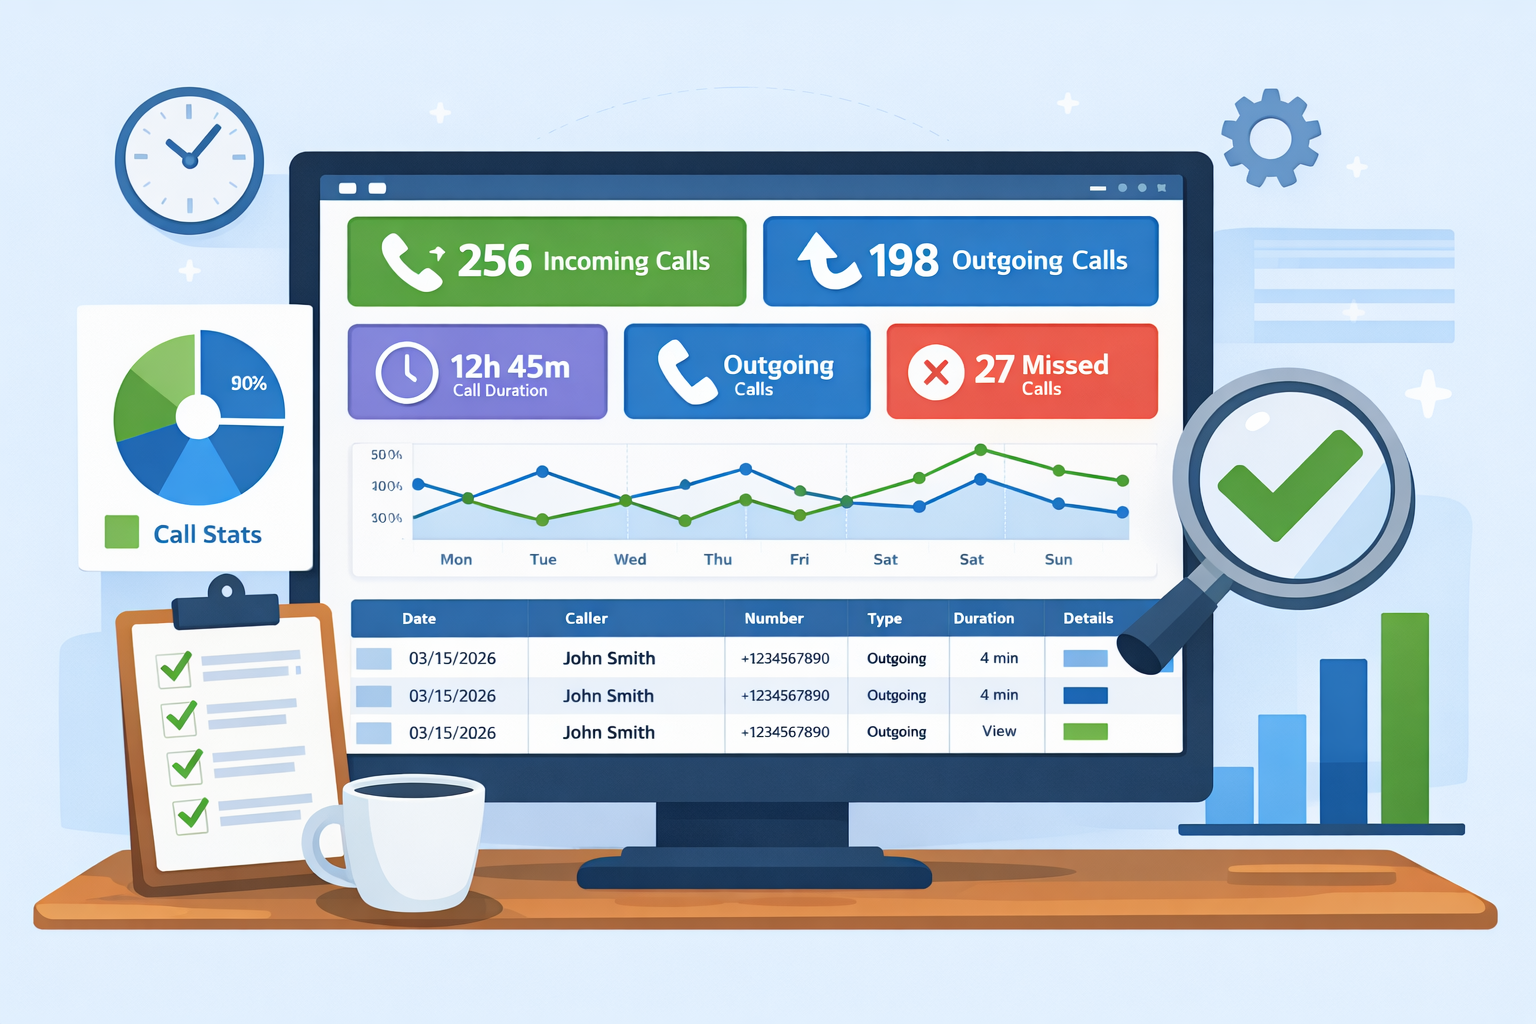
Call Statistics Dashboard (Calls Only) — Full Analytics from Your Mobile
The Call Statistics Dashboard in SMSMobileAPI gives you a complete, centralized view of phone call activity collected from your connected mobile device.
From one screen, you can analyze incoming calls, outgoing calls, missed calls, call volumes, durations, date/time activity, and detailed logs — with filters and search tools designed for fast monitoring and operational follow-up.
What the Call Stats Dashboard Is Designed For
This page is dedicated to call-related statistics only. It is ideal for businesses and teams who want clear visibility into phone activity without manually checking each device.
- Track call volumes over a selected period (day, week, month, custom range).
- Compare incoming vs outgoing activity / Missed Call to understand how your team communicates.
- Monitor call durations for workload, support follow-up, or sales behavior analysis.
- Find specific calls quickly with keyword search and date filtering.
- Review detailed call logs from a single dashboard view.
- Use API access to connect CRM, automation tools, reporting systems, or BI dashboards.
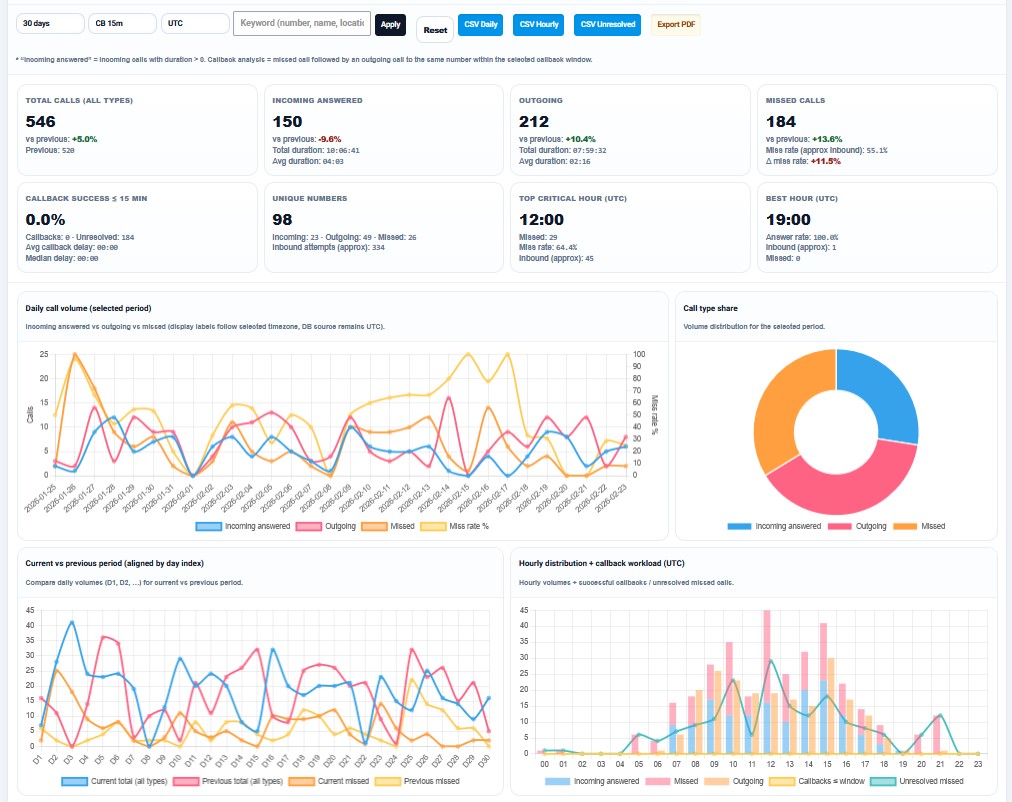
Main KPIs Available in the Calls Dashboard
The Dashboard page is built to surface the most important call metrics first, so you can understand performance in seconds before reviewing details.
Global count for the selected period and filters.
Calls received on your connected mobile device.
Calls placed from your connected mobile device.
Total / average duration to evaluate workload and activity quality.
Advanced Filters for Fast Analysis
The dashboard includes a practical filtering system so users can isolate the exact data they need without exporting anything first.
- Date range filter (start date / end date) for custom reporting periods.
- Keyword search to find calls by number or contact name.
- Call type filter (incoming / outgoing / all).
- Status-oriented filtering depending on available call attributes in your log source.
- Quick reset / refresh to return to global stats instantly.
This makes the page suitable for support teams, sales teams, and administrators who need rapid daily checks.
Why This Matters in Real Operations
Looking at raw call logs line by line is slow. A statistical dashboard turns your mobile phone activity into business visibility.
- See if call activity increases after a campaign or promotion.
- Measure how much outbound effort is made each day.
- Detect quiet periods and optimize staffing or follow-up schedules.
- Identify heavy-use days for support or customer service.
- Prepare clear reports for internal tracking or partner updates.
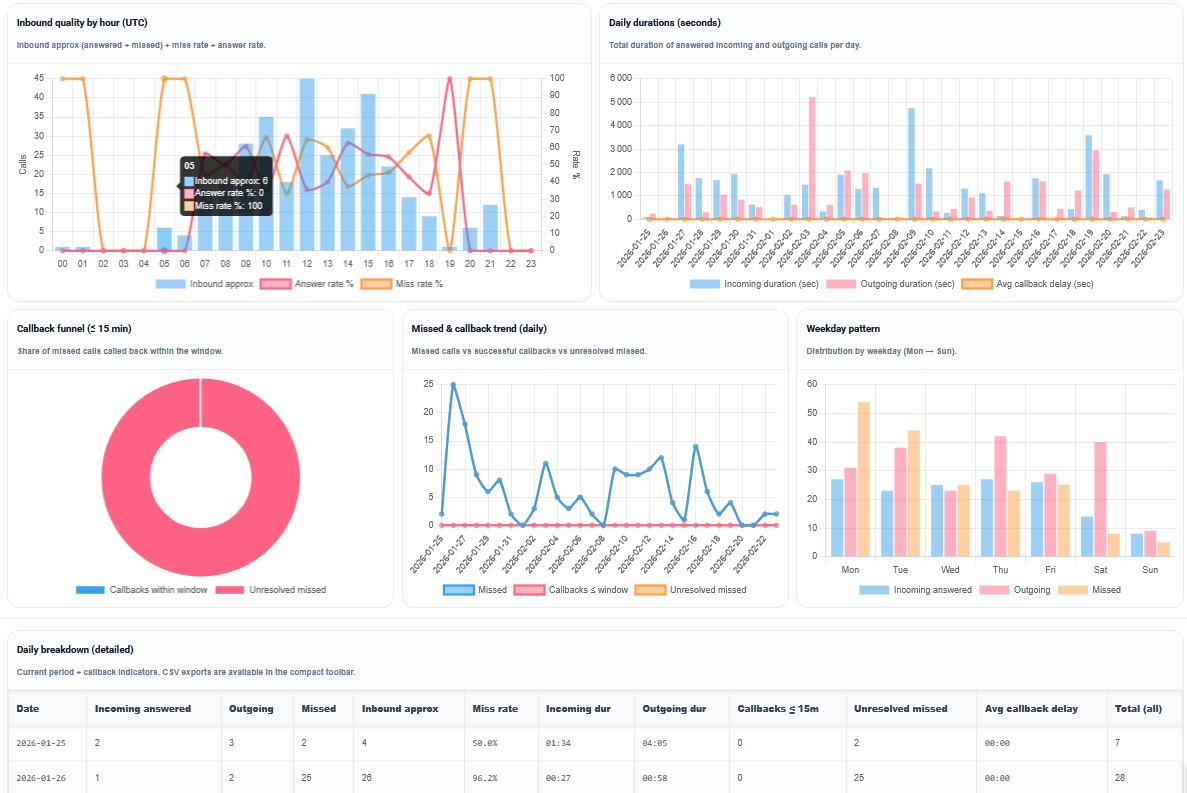
Detailed Analytics You Can Display in the Dashboard
The call stats page can present a broad overview and still allow deeper analysis. Depending on how your Dashboard page is configured, you can surface metrics such as:
| Dashboard Metric / View | What It Shows | Why It Is Useful |
|---|---|---|
| Total calls by period | Overall call count in selected date range | Quick top-level performance indicator for phone activity. |
| Incoming vs outgoing split | Inbound and outbound call distribution | Understand whether your phone usage is reactive (support) or proactive (sales/follow-up). |
| Total call duration | Combined time spent on calls | Useful for workload analysis and communication intensity tracking. |
| Average call duration | Mean duration per call | Helps compare call quality and efficiency across periods. |
| Daily trend chart | Call activity evolution by day | Highlights peaks, drops, campaign effects, and seasonal behavior. |
| Hourly distribution | Calls by hour of day | Shows best hours for availability, follow-up, or customer contact. |
| Top callers / frequent numbers | Most recurring inbound or outbound numbers | Identify key customers, recurring contacts, or internal communication patterns. |
| Detailed call log table | Date, time, direction, number, contact, duration | Operational review and drill-down after checking summary metrics. |
Dashboard Visibility + API Access
One of the strongest advantages of SMSMobileAPI is that your call data can be used in two complementary ways:
- Dashboard mode: visual statistics, filters, charts, and quick call history review for humans and teams.
- API mode: programmatic access to call logs and call activity so your systems can automate reporting, CRM enrichment, or workflow triggers.
This means you can inspect the same data manually in the dashboard and also pipe it to your own tools for automation or advanced reporting.
Examples of Use Cases with the Call Stats API
- Create a daily call report sent by email to a manager.
- Push frequent callers into a CRM contact activity timeline.
- Trigger a follow-up task when there is a high volume of inbound calls.
- Compare outbound call effort with conversion data in a sales dashboard.
- Build a custom KPI screen combining SMS + Calls + WhatsApp activity.
- Archive call statistics per month for financial/operational review.
Your dashboard remains the easiest human-readable view, while the API enables automation and integrations.
Clear Timestamps and Better Understanding of Call Activity
A call statistics dashboard is only useful if the timestamps are easy to interpret. SMSMobileAPI is designed to make call logs and statistics easier to read with clear date/time information in the dashboard.
This is especially important for teams working across different time zones or for users checking activity from the web dashboard while the mobile device is elsewhere.
- Readable call date/time in the dashboard.
- Consistent filtering by date range for accurate period stats.
- Reliable correlation between dashboard views and detailed call log entries.
- Better analysis quality when comparing call activity over time.
Fast Overview First
See totals and key metrics immediately without opening each log entry. Perfect for a quick daily check.
Drill-Down When Needed
Start from statistics, then inspect the detailed call table to understand exactly what happened.
Mobile-to-Web Continuity
Calls are handled on your phone, while analysis happens in the dashboard for a bigger, clearer view.
Why Businesses Use a Dedicated Call Statistics Dashboard
A dedicated call analytics dashboard gives much more value than a simple call history list. It helps transform call logs into actionable information: performance, workload, communication habits, peak periods, and follow-up opportunities.
With SMSMobileAPI, your connected mobile phone becomes a source of structured communication data — and the Calls Stats Dashboard turns that data into clear insights for daily operations.
FAQ — Call Stats Dashboard
What is the Call Statistics Dashboard in SMSMobileAPI?
It is a dashboard page that summarizes call activity from your connected mobile: incoming calls, outgoing calls, volumes, durations, trends, and detailed call log insights.
Can I filter the statistics by date and search specific numbers?
Yes. The dashboard is designed to support date range filtering and keyword search so you can quickly find the relevant calls and analyze a specific time period.
Is API access available for call data?
Yes. SMSMobileAPI supports API-based access to call information so you can integrate call logs and call statistics into your CRM, reports, automations, or internal tools.
Can I use this for both incoming and outgoing calls?
Yes. The dashboard is built to analyze call activity by direction, including inbound and outbound calls, and can be extended with additional categories depending on your setup.
Is this feature available on iPhone (iOS)?
Call-log related features depend on operating system permissions. SMSMobileAPI call log functions are generally designed around Android capabilities.
Get a Complete View of Your Call Activity
Use SMSMobileAPI to collect call data from your mobile and analyze it in a dedicated dashboard with API-ready access.

Call log/statistics features are available on Android (depending on granted permissions).
Configure your account from the web dashboard, then connect your mobile to sync call activity.